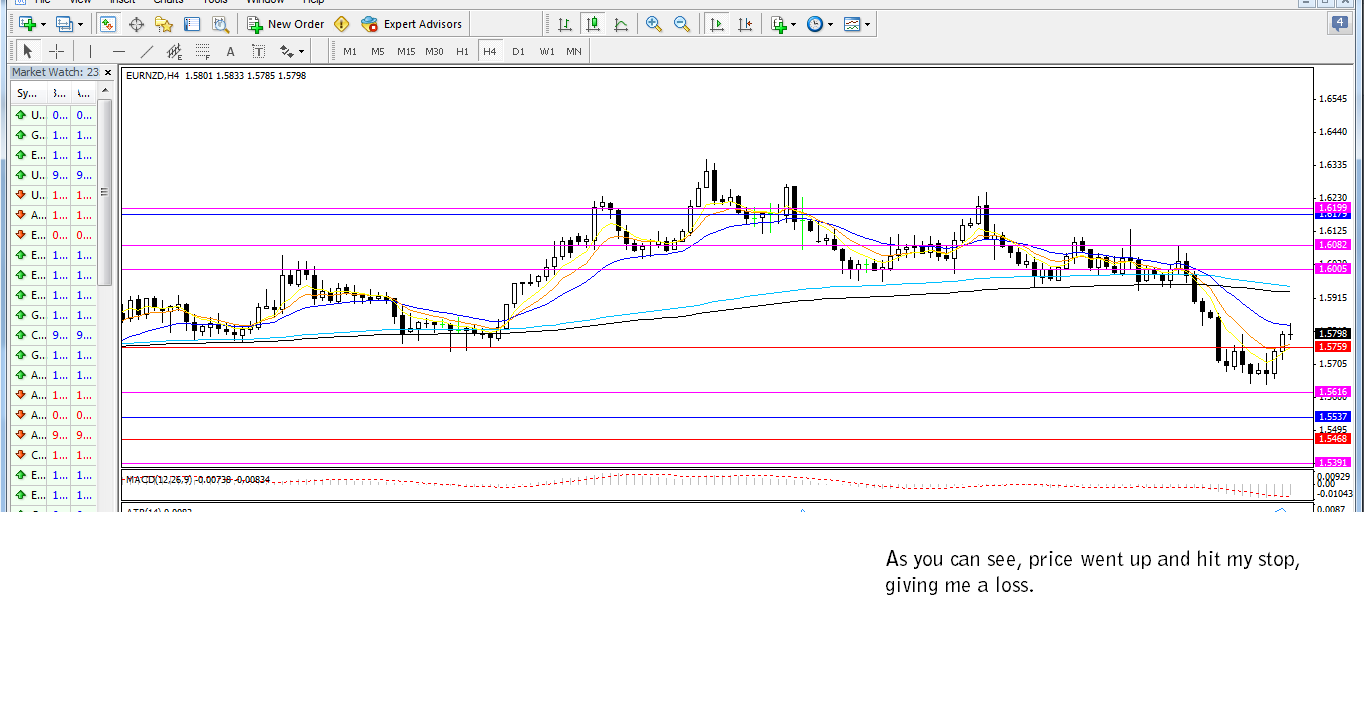
I've explained this strategy before but probably didn't make it as clear as it could be, so here it is again. I call it the three time frame strategy, and it was taught to me by my friend Neale. This strategy is based on three timeframes. H4, H1 and M15. Below are the conditions of entry for a short trade (obviously you do the opposite for a long trade.
For a short trade
1.Price must be trending below the 200ema on the H4 and H1 chart.
2.Price must have pierced the 21 ema on the H4 chart
3.Price must be trending above the 200ema on the M15
4. If there is an obvious upward trend line on the M15 chart, you wait for it price to close below it and then enter short. If price closes below the 200ema in addition to the trend line that's even better.
Discretion
This is not a mechanical strategy so some discretion should be used. The trend line should be a nice obvious one (see chart below), and ideally should not be very steep. If the bar that closes below the 200ema is a large one, you should wait for a retrace before entering so you get a a better price.
Trade management
I like to have my stop loss at the highest point visible on the M15 charts without having to scroll back (as long as it's no more than 40 pips). If it's more than 40 pips, then I'll pick the second highest point. Either way, stop losses are between usually around 30-40 pips.
Profit target is 3 times the stop loss or 3:1 RR. For the trade below, my stop was 40 pips, and so the target was 120 pips. Once you hit 1:1 RR, you move your stop to break even. No messing around with it. It either hits your stop, or hits your target.
Win rate
With a target of 3:1 RR you obviously can't expect a high win rate, but that's no problem because you can still make very good money. When I back tested this for 4 different pairs, my win rate was between 27 and 35%. The majority of trades ended up at break even, and the rest were losses. Having traded it live since the start of the year, my results with it are very good, but it's early days so we'll have to see if in the long term my results match my back testing results. If so, I'll be very happy.
Example
Anyway, here's an example trade I made today that hit my 3:1 RR target. Here's the entry chart on the M15. Chart. Remember, I entered short because price was trending below the 200ema on the H4 and H1 charts. (click chart to enlarge) Notice the obvious trend line.
Here is the exit chart. Price moved down, and hit 1:1 RR after which I moved my stop to break even. The next time I looked at the chart it had moved further down and hit my 3:1 RR Target.