Thursday, 28 February 2013

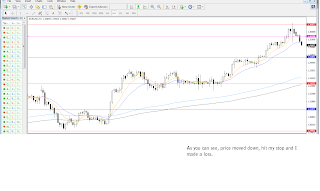
27/02/2013 EUR/AUD short (loss)


Short trade off the H4 chart. Here is my entry chart which explains everything. Risk was 0.5%, aiming for 2:1 RR (click chart to enlarge).


and here is the exit chart showing price going up and stopping me out before continuing downwards towards my target.


Although the trade lost, I don't think it was a bad one to take. 

Monday, 25 February 2013

25/02/2013 EUR/NZD short (win)


After a tough couple of weeks it's nice to finally get a decent win. This was a short trade based on EUR/NZD the three time frame strategy (explained here). Here is my entry chart (click to enlarge)


and here is the exit chart. As you can see, price moved down, hit my stop and made me a tidy profit of 3:1 RR.


Three time frame strategy explained


I've explained this strategy before but probably didn't make it as clear as it could be, so here it is again. I call it the three time frame strategy, and it was taught to me by my friend Neale. This strategy is based on three timeframes. H4, H1 and M15. Below are the conditions of entry for a short trade (obviously you do the opposite for a long trade. 


For a short trade

1.Price must be trending below the 200ema on the H4 and H1 chart. 
2.Price must have pierced the 21 ema on the H4 chart
3.Price must be trending above the 200ema on the M15
4. If there is an obvious upward trend line on the M15 chart, you wait for it price to close below it and then enter short. If price closes below the 200ema in addition to the trend line that's even better. 

Discretion

This is not a mechanical strategy so some discretion should be used. The trend line should be a nice obvious one (see chart below), and ideally should not be very steep. If the bar that closes below the 200ema is a large one, you should wait for a retrace before entering so you get a a better price. 

Trade management 

I like to have my stop loss at the highest point visible on the M15 charts without having to scroll back (as long as it's no more than 40 pips). If it's more than 40 pips, then I'll pick the second highest point. Either way, stop losses are between usually around 30-40 pips. 

Profit target is 3 times the stop loss or 3:1 RR. For the trade below, my stop was 40 pips, and so the target was 120 pips. Once you hit 1:1 RR, you move your stop to break even. No messing around with it. It either hits your stop, or hits your target. 

Win rate

With a target of 3:1 RR you obviously can't expect a high win rate, but that's no problem because you can still make very good money. When I back tested this for 4 different pairs, my win rate was between 27 and 35%. The majority of trades ended up at break even, and the rest were losses. Having traded it live since the start of the year, my results with it are very good, but it's early days so we'll have to see if in the long term my results match my back testing results. If so, I'll be very happy.

Example

Anyway, here's an example trade I made today that hit my 3:1 RR target. Here's the entry chart on the M15. Chart. Remember, I entered short because price was trending below the 200ema on the H4 and H1 charts. (click chart to enlarge) Notice the obvious trend line. 


Here is the exit chart. Price moved down, and hit 1:1 RR after which I moved my stop to break even. The next time I looked at the chart it had moved further down and hit my 3:1 RR Target. 


Friday, 22 February 2013

21/02/2013 GBP/JPY short (loss)


Another short trade off the H4 chart. These have been killing me lately. Anyway, here is the entry chart which explains everything (click to enlarge). Risk was 0.5%, aiming for 2:1 RR.


and here is the exit chart showing price going up and hitting my stop loss.


Wednesday, 20 February 2013

19/02/2013 EUR/NZD short (loss)


Short trade off the EUR/NZD daily chart. Chart explains everything. Risk was 0.5%, aiming for 2:1 RR (click chart to enlarge).


and here is the exit chart showing price hitting my stop and taking me out. In hindsight it was a bad one to take since I sold right into support. 


Monday, 18 February 2013

15/02/2013 GBP/USD


Another short trade off the H4 charts, this time on GBP/USD. Here is my entry chart which explains everything (click chart to enlarge).


and here is the exit chart showing price hitting my stop. Was out having a beer when I checked to see how this trade was doing. Shouldn't have bothered. Drink didn't taste so good after this loss, but I had a few more anyway. Bad way to end the week.


15/02/2013 EUR/NZD short (loss)


This was a short trade on EUR/NZD H4. Here is my entry chart which explains everything. Risk was 0.5%, aiming for 2:1 RR (click chart to enlarge).


and here is the exit chart showing price going up and hitting my stop loss. This one took me out almost as soon as I entered. Quick, but not painless.


15/02/2013 GBP/CAD short (loss)


Short trade on GBP/CAD H4. Here is my entry chart explaining everything (click to enlarge). Risk was 0.5%, aiming for 2:1 RR.


and here is the entry chart showing price going up and hitting my stop.


Saturday, 16 February 2013

14/02/2013 CAD/CHF short (a loss that should have been a win)


This is a trade that I should have won but didn't thanks to an idiotic mistake. Inexcusable. Here's the entry chart (click to enlarge). Risk was 0.5% and the target was 2:1 RR (risk/reward ratio).


And here is the excit chart. Notice that the high of the pinbar was NOT violated. The pin did not fail. Why did I get taken out? Because I didn't take the spread (about 5 pips I think it was) into account when I set my stop loss. Therefore I was stopped out. The trade then went in my direction and I would have made a 2:1 profit had I not been an absolute clown and just had my stop loss a few pips higher by taking the spread into account. 


Amateur mistake.

Thursday, 14 February 2013

13/02/2013 USD/CHF short (loss)


I entered short on the daily chart after a bearish engulfing outside bar off a pretty good horizontal level. Here is my entry chart (click to enlarge). Risk on this trade was 0.5% and I was aiming for 2:1 RR.


And below you can see the exit chart showing price making a strong move and taking me out for a loss. Had this one open overnight. Not a nice start to the day, waking up and seeing a loss, but hey, it happens.


At this point in time, I still feel it was a decent trade to take. 

Wednesday, 13 February 2013

11/02/2013 NZD/USD long (win)


Took this trade a few days ago and it just hit my target today. This was a pinbar I took to go long on the daily chart. Here is my entry chart which explains everything (click to enlarge). Risk was 0.5% as usual, and I was aiming for a profit of 2:1 RR.


and here is the exit chart which shows price going up and hitting my target, giving me a nice 2:1 profit.


Took a couple of days to hit the target but I hardly monitored this trade. Chart watching is a waste of time unless you're a scalper. You'd be better off playing golf or something. Just checked it every hour or so and moved my stop to break even once I hit 1:1. Trying to become less emotionally attached to my trades, and I think it helps to just walk away from the screen for a while. 

Tuesday, 12 February 2013

11/02/2013 AUD/NZD short (win)


This is a trade I entered yesterday that I closed out today for a profit of 3:1 RR. Classic trade based on the 3 timeframe strategy that I explain here . Here is the entry chart explaining the trade (click chart to enlarge).


and here is the exit chart which shows price moving down and hitting my target of 3:1 RR. Sweet! If only every trade was like this eh?


12/02/2013 GBP/JPY long (loss)


This was a frustrating trade I took today because it was going so well until a G7 meeting (I think). Somebody said something which caused all the yen pairs to move down rapidly. I know a lot of traders that were long on the yen pairs got burned today. Like I said earlier, somebody needs to crash these meetings and give a stone cold stunner to everyone in the room. They have the nerve to mess up trades like this? Shieeeeeet. Next time they should give me a shout and ask me if I'm in any positions before they go ahead influencing the prices and shit. Anyway, it happens. Here is my entry chart explaining stop loss, entry, and reason for entry. Risk was 0.5% as usual, and I was aiming for 2:1 RR.


and here is the exit chart. Self explanatory really. Price moved up, got me excited, then moved down and took me out. ANOTHER loss! What can you do but move onto the next one?


Monday, 11 February 2013

11/02/2013 GBP/JPY long (loss)


This was a trade taken off the M15 chart, based on the 3 time frame strategy (explained here). Risk was 0.5%, and target was 3:1 RR. The entry chart shows stop loss, entry and target.


and here is the exit chart, showing price going down and hitting my stop, giving me a loss.


06/02/2013 AUD/JPY long (loss)


A long trade on the AUD/JPY daily chart. Here is the entry chart which explains stop loss, entry, target, and reason for entry. Risk was 0.5%, aiming for 2:1 RR (click chart to enlarge).


and here is the exit chart which shows price moving down and hitting my stop, giving me a loss.


Monday, 4 February 2013

04/02/2013 EUR/JPY long (loss)


Another long trade of the H4 chart. Here is the entry chart showing stop, entry, target and reason for entry. Risk was 0.5%, aiming for 2:1 RR (click chart to enlarge).


and here is the exit chart showing price going down, hitting my stop and giving me a loss.


I don't follow the economic news but I heard that the Euro went down today because of some alleged scandal involving Mariano Rajoy. That fool! He owes me 0.5% of my account. 


03/02/2013 EUR/USD long (loss)


Long trade of the H4 chart. Here is my entry chart showing stop, entry, target and reason for entry. Risk was 0.5%, aiming for 2:1 RR (click chart to enlarge). 


and here is the exit chart showing price going down, hitting my stop and giving me a loss.