Thursday, 31 January 2013

End of month review January 2013


So I began 2013 with a new trading plan having done a fair bit of back testing on my strategies, and it's been a fuckin' emotional rollercoaster. I've ended the month in profit, but at times I wasn't sure if this was gonna happen. Got off to a good start in the first week of the new year. 5 trades in the first week. 3 wins and 2 losses. All 3 wins had a profit ratio of 2:1 (meaning I made twice as much as my risk). Remember, for the moment I'm only risking 0.5% of my account per trade, so to end the first week with a 1.5% gain on my account was a good result. The following week was even better. I made 7 trades, with 3 losses, 1 break even and 3 wins. Two of those wins had a profit ratio of 2:1 and the other one was 3:1. I made a 2% gain on my account that week This is only risking 0.5% per trade. If I had risked 2%, I would've made a 8% gain on my account in a week! A bank wouldn't give you that in a whole year! Man this is going well I thought. 


The next week was a fuckin' bad week. 10 trades, 2 break even and 8 losses. Everything I had made in the first couple of weeks I gave back. Felt like I was in a boxing ring getting a good beat down. The market was beating me up. I was just glad when that week was over. 

Week after that I only made 4 trades. Two losses and two wins at 2:1 a piece. Nice to end the week in profit. 

This week I made a terrible start. Made 5 trades on Monday and lost them all. Felt low. It wasn't even lunch time on monday and I had lost 3 already. Two of those losses should never have happened. I didn't follow my trading plan properly. The other 3 I have no problem with because I followed my trading plan, and I know losses are part of the game. Then two winning trades at 3:1 and 2:1 put me back at break even for the week. Ups and downs, ups and downs, it's been an emotional rollercoaster. This week was particularly difficult with the 5 losses on Monday, but the month ended up well. Not a lot of profit (a 0.8% gain on my account to be exact), but I can't complain too much. I'm still learning, still a novice in the game, still back testing, and I'm better than most novices. In fact I'm better than a lot of guys who have been at this game for a long time. I'm no clown, and I WILL become a winner. In Rocky Balboa, Rocky gave a speech to his son, saying how life will beat you down but you have to keep moving forward, because that's how winning is done. That's trading. I know losses are a part of my strategy, because I will not have a high win rate. What I do know is that when I win, those wins will be 2:1 or 3:1, and in the long run I will come out on top. I have spent hours and hours back testing, and I am recording every one of my trades in a spreadsheet as well as on this blog. It's very difficult to keep going and believe in your strategy when you get 8 losses in a row, but nobody said this game was easy. 


31/01/2013 EUR/JPY long (win)


This was a long trade off the H4 chart. Here is my entry chart that shows stop, entry, target and also reasons for entry. Risk was 0.5%, aiming for 2:1 RR.


And here is the exit chart showing price going up, hitting my target and giving me a profit of 2:1 RR.


29/01/2013 GBP/JPY long (win)


This was another long trade taken from the M15 chart, based on the 3 time frame strategy (explained here). Risk was 0.5% as usual, and the target was 3:1 RR. Here is the entry chart (click to enlarge)


Here is the exit chart, showing price going up, hitting my target and making me a nice 3:1 profit.


28/01/2013 GBP/CAD long (loss)


A long trade of the H4 chart. Here is my entry chart explaining stop, entry and target, as well as reasons for entry. Risk was 0.5%, aiming for 2:1 RR. Click chart to enlarge. 


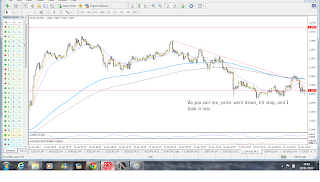
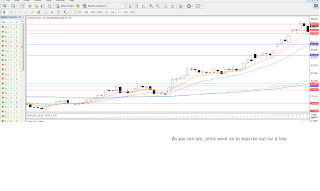
And here is the exit chart, showing price going down, hitting my stop and giving me a loss. 


The trade didn't work out but I was justified in taking the trade and would do so again. 

Monday, 28 January 2013

28/01/2013 GBP/NZD short (loss)


Here i a short trade I took off the GBP/NZD daily chart. The entry chart explains stop, entry, target, and reason for entry. Risk was 0.5%, aiming for 2:1 RR (click chart to enlarge).


and here is the exit chart that shows price going up and hitting my target, stopping me out for a loss. 


again, even though I lost, I don't see this as a bad trade. 


28/01/2013 USD/JPY long (loss)


Went long here off the H4 chart. Entry chart explains stop, entry, target and reason for entry. Risk was 0.5%, aiming for 2:1 RR (click chart to enlarge). 


and here is the exit chart that shows price going down and hitting my stop, giving me a loss. 


In hindsight, was this a good trade to take? Yeah, I don't see anything wrong with it, it just didn't work out on this occasion. 

Thursday, 24 January 2013

23/01/2013 EUR/NZD long (profit)

Another profitable trade. Long trade on EUR/NZD H4 time frame. The entry chart below explains, stop, entry, target, and reason for entry. Risk was 0.5%, aiming for 2:1 RR. Click chart to enlarge.


Here is the exit chart. Was almost stopped out. Survived by a few pips but in the end price went back up and hit my target of 2:1 for a nice bit of profit.


Wednesday, 23 January 2013

22/01/2013 GBP/NZD Short (win)


Finally a winning trade after that losing run. Short trade on GBP/NZD H4. Here is the entry chart, which explains stop, entry, target, and reason for entry. Risk was 0.5%, aiming for 2:1 RR (click chart to enlarge).


Here is the exit chart that shows price hitting my target and giving me a profit of 2:1 RR


Tuesday, 22 January 2013

21/01/2013 EUR/USD Long (Loss)


Entered long on the m15 chart based on the 3 time frame strategy (explained here). Here is my entry chart which explains stop, entry and target. Risk was 0.5%, aiming for 3:1 RR. Plan was to move stop to break even when I hit 1:1 RR Click chart to enlarge.


Here is the exit chart. As with the AUD/JPY trade, I left this one open overnight also. Price once again hit 1:1, but as I was sleeping I didn't have a chance to move stop to break even. Therefore I woke up this morning with a loss.


Two trades left open overnight, didn't get a chance to move stop to break even. That's how an idiot trades. I've learned my lesson. No more of this shit. Haven't had a win for a while now and all those gains I made in the first 2 weeks of this month have been lost. Stress, pressure, it's fuckin' tough, but it won't break me. These losses knock you down, make you doubt yourself, but you have to get back up and keep moving forward. "That's how winning is done". That's why I'm still recording all of my trades and posting them online. You will all see the transformation, when I turn into a world class trader. You'll see the journey as it happened. I'm hiding nothing here. 


21/01/2013 AUD/JPY long (loss)


Here's a trade I opened yesterday, based on the 3 time frame strategy (explained here). Chart explains, entry, stop and target. Plan was to move stop to break even once price hit 1:1. Risk was 0.5%, aiming for 3:1 RR. Click chart to enlarge.


And here is the exit chart. As you can see, price did hit 1:1 but because I left the trade open overnight like an idiot, I was sleeping and didn't have a chance to move stop to break even once price hit 1:1. Therefore I woke up in the morning with a loss. Unacceptable.


Monday, 21 January 2013

18/01/2013 USD/JPY Long (break even)


Entered long on USD/JPY H4. Chart explains stop, entry, target and reason for entry. Click chart to enlarge. Risk was 0.5% and aiming for 2:1 RR.


Moved stop to break even when price hit 1:1. Here is the exit chart which shows price then hitting my stop and stopping me out at break even


Sunday, 20 January 2013

6 losses in a row


So after a great start to the new year with a 1% gain on my account in the first week and a 3% gain in the second (keep in mind I'm only risking 0.5% per trade), I had a pretty bad week last week. 6 trades, all of them losses at 0.5%. The thing is though, it doesn't bother me that much because I have backtested my trading strategies over 1 to 4 years and I know they work over the long run. My winning percentage depending on which strategy I use will be between 27% and 47%. But my wins are all gonna be either two or three times as big as my stop loss. Market conditions change, but they can only change in so many ways. Either there is gonna be an uptrend, a downtrend, or sideways movement. Trends can be strong or weak. Movement can be clean or choppy. I've watched the charts for over a year now and I think I know when to trade and when to stay out. Time will tell if I'm right.

Suppose someone said they will give you 100 flips of a coin. Every time it lands on heads, you will have to pay the guy $5, but every time it lands on tails he pays you $10. You would be crazy to turn this down. The coin might land on heads 8 times in a row. At this point you might be thinking "oh shit, what did I get myself into?". If you flip it 100 times, in the end it will work out roughly 50/50 though. After a hundred flips you would have made a lovely bit of profit. Try flipping a coin yourself. You might land on one side 6 times in a row. That's with a 50/50 outcome. With my trading strategies the winning percentages are less than 50%, so it's not surprising at all that drawdown sometimes occurs and a losing run can occur. Every trader has to take losses. Sometimes he'll be on a losing run, but if the strategy works, he'll come out out of that losing run and win in the long run. Winning percentages used to bother me. I wanted to win 80% of my trades or higher at one point. Now, making money is all that matters.

Still, losses can be a bit discouraging, especially for a rookie trader like me. That's when I have to keep moving forward, putting in the work. A punk would cave into the pressure, but a winner would play a beat


and remember he's in this for the long run, so he can create the lifestyle of a champion. That's what winners do. Because I have visualized hiring the apartment below and trading from it. That's why I've spent many hours at the weekend backtesting, like some clown with no life. That's why I've been OBSESSED with trading for the last year and a half and have spent hours each day trading, studying, backtesting, and talking trading. So I can create the lifestyle of a king. I currently have a trade open which is close to hitting my profit target of 2:1 RR, so maybe I'll get back to winning ways by tomorrow morning.


Saturday, 19 January 2013

17/01/2013 USD/CHF short (loss)


This loss made it 6 in a row. Not easy to take, but when you're using strategies that have a win percentage between 26 and 47%, it can happen. Just have to believe in your strategies by doing the backtesting first. This was a short trade on USD/CHF daily chart. Chart explains stop, entry, target and reason for trade. Risk was 0.5%, aiming for 2:1 RR. Click chart to enlarge.


Here is the exit chart. As you can see, I made a loss.


In hindsight it was a little bit risky taking the setup without a good horizontal level to go with the EMA's. Look how it closed at the end of the day. It formed another pinbar, this time off a good horizontal level. This is probably a better place to go short from. 


16/01/2013 NZD/JPY long (loss)


Another trade based off the 3 time frame strategy (see explanation here). Entered long with 0.5% risk, aiming for 3:1 RR. Here is the entry chart (click to enlarge)


and here is the exit chart which shows price going down and stopping me out for a loss


In hindsight maybe I should have waited for a stronger close above the trendline and 200 ema. 

16/01/2013 EUR/AUD long (loss)


Another trade based on the 3 timeframe strategy (explained here). Here is the entry chart (click to enlarge). Risk was 0.5%, aiming for 3:1 RR.


and here is the exit chart. As it shows, price went down, hit my stop and I made a loss.


I made a loss but would I take the trade again? Yes. 

17/01/2013 AUD/SGD long (loss)


Again I entered long on the AUD/SGD daily chart. Chart explains stop, entry and target, and reason for entry. Risk was 0.5%, aiming for 2:1 RR. Here is the entry chart (click to enlarge)


and here is the exit chart showing price going down and stopping me out for a loss


Although the trade didn't work out I followed my plan and would take the same trade again. 

16/01/2013 AUD/SGD long (loss)


Long trade on AUD/SGD daily. Chart explains stop, entry, target and reason for entry. Risk was 0.5% , aiming for 2:1 RR. Here is the entry chart (click to enlarge). 


Here is the exit chart. As chart shows I was stopped out and made a loss. 


15/01/2013 NZD/CHF short (loss)


Here is a short trade on the NZD/CHF H4 chart. Reason for the trade is a big pinbar off a strong horizontal level on the daily chart. Here is the entry chart (click to enlarge)


Here is the exit chart. As it shows, price went up and stopped me out for a loss


Would I take the trade again? I'm not sure to be honest. It was a strong uptrend but the pinbar was very nice and it was off a strong daily level. 


11/01/2013 GBP/AUD short (loss)


Short trade on GBP/AUD H4. Chart explains stop, entry, target and reason for entry. Risk was 0.5%, aiming for just under 2:1 RR. Here is entry chart (click to enlarge).


Here is the exit chart, showing price going up and stopping me out for a loss.


in hindsight I would take the trade again since I followed my plan and I could justify the trade. 

09/01/2013 CAD/JPY long (profit)


This trade made it 3 profitable trades in a row. Entered long on the M15 chart, based on a strategy that uses 3 different time frames (see explanation here ). Here is the entry chart (click chart to enlarge). Risk was 0.5% aiming for 3:1 RR this time. Plan was to move stop to b/e as soon as price hit 1:1 RR.


 Here is the exit chart. As you can see price went up and hit my target giving me a great profit of 3:1 RR! The winning percentage on this strategy is not high  but each win is worth 3:1 so it feels damn good when it works out.


10/01/2013 USD/JPY long (profit)


Long trade on H4. The yen pairs have been in a very strong uptrend lately. Great conditions for trading. Here is my entry chart with reason for the trade, and stop, entry and target. Risk was 0.5% of my account, and I was aiming for 2:1 RR (click chart to enlarge)


Here is my exit chart. Price went up, hit my target and gave me a nice profit of 2:1 RR.


10/01/2013 CAD/CHF long (profit)


Short trade on CAD/CHF daily. Chart explains reasons for entry as well as stop, entry and target. Risk was 0.5%, aiming for 2:1 RR (click chart to enlarge)


Here is the exit chart. The same day price went down and hit my target, giving me a nice profit of 2:1 RR. 


07/01/2013 AUD/CHF short (loss)


Here is a short trade on AUD/CHF daily chart after a fakey/pinbar. (click chart to enlarge)


Here is the exit chart. Price went up and stopped me out for a loss. 


Even though I lose I would take the trade again. 


07/01/2013 USD/JPY long (loss)


Long trade on USD/JPY. Chart explains entry, stop and target. Risk was 0.5%, aiming for 2:1 RR (click chart to enlarge)


Here is the exit chart. The next day price went down and stopped me out for a loss. 


In hindsight, although it failed I would take the trade again. 


07/01/2013 EUR/JPY Short (break even)


This next trade is off the M15 chart. Basically this strategy that was taught to me by my mentor Neale is based on 3 different time frames. The H4, H1 and M15 charts. Price must be trending above/below the 200ema on the H4 and H1, and must be doing the opposite on the M15 chart. Then you look for an obvious trendline on the M15 chart, wait for price to break out of the trendline and close above it. Then you enter. Here is an example. H4 and H1 charts were trending above the 200 ema (black line on my chart), and the M15 was trending below it. Once the trendline broke I entered long. The plan is to aim for 3:1 RR but move stop to break even when price hits 1:1 RR (click chart to enlarge)


and here is the exit chart. Once price broke the trendline it hit 1:1 RR at which point I moved my stop to break even. Price then went down and stopped me out at 1:1


04/01/2013 EUR/NZD short (profit)


Short trade here on EUR/NZD H4. Chart explains entry, stop and target, and reason for entry. Risk was 0.5%, aiming for 2:1 RR (click chart to enlarge).


I held this trade over the weekend and here is the exit chart which shows price going down and hitting my target on monday, giving me a profit of 2:1 RR.